Petaluma Population Growth Forecast (2030, 2035, 2040): What It Means for Home Prices
Nima Kazeroonian June 16, 2026
Nima Kazeroonian June 16, 2026
If you’re tracking the North Bay housing market, “population” isn’t just trivia—it’s one of the best early signals of future demand. Population growth doesn’t guarantee appreciation, but it does stack the deck: more households typically mean more competition for the same limited inventory.
In this post, I’ll keep it simple: what Petaluma looks like now, where credible datasets suggest it’s headed (2030, 2035, 2040), and the practical implications for the housing market—especially if you’re trying to time a purchase or a sale in the next few years.
Petaluma isn’t a hyper-growth “boomtown,” but it remains highly desirable because it pairs small-city feel with Bay Area access.
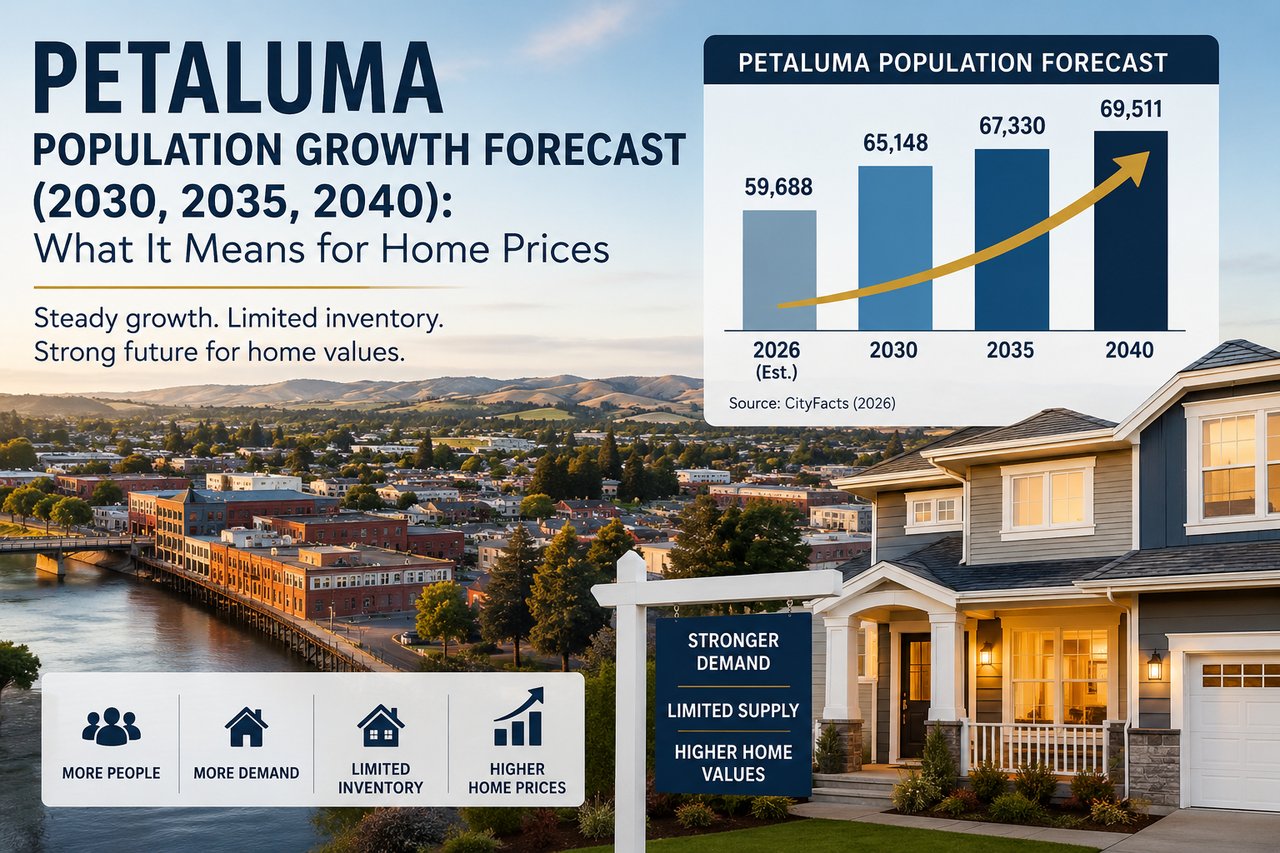
The U.S. Census Bureau’s QuickFacts shows Petaluma’s July 1, 2025 population estimate at 59,688.
Meanwhile, the California Department of Finance (DOF) publishes annual January 1 population estimates (housing-unit based) for cities and counties, including Petaluma, which are typically consistent with Census estimates over time.
Why this matters: starting close to ~59.7k people and adding even a few thousand households over a decade can materially shift prices—because Petaluma has historically had a constrained supply environment compared to demand.
Before zooming into Petaluma’s point estimates, it helps to understand the structural trend: the Bay Area’s long-range planning bodies anticipate population growth through 2050. The Association of Bay Area Governments (ABAG) and Metropolitan Transportation Commission (MTC) maintain the region’s forecasts and notes that Plan Bay Area 2050+ was adopted in March 2026, with projections at the regional and sub-regional level.
That doesn’t mean every neighborhood booms equally—but it does mean migration patterns, household formation, and long-run jobs/housing dynamics are still the dominant story.
One of the easiest, transparent forecasting approaches is to use historical and projected trend datasets that are designed for long-range analysis. CityFacts publishes a “Historical and Projected Population” series for Petaluma, showing:
It doesn’t list 2035 directly, but if you simply take the midpoint growth between 2030 and 2040, you get:
How I interpret this: That implies moderate growth—less than 1% per year—which is *exactly the kind of growth path that can quietly and steadily push prices up when inventory is tight.
Petaluma’s long-range planning has historically estimated what full buildout could look like. In the Petaluma General Plan 2025 (an adopted long-range plan from the 2000s), the buildout population was shown as 72,707, with an annual growth rate of ~1.2% projected over a 20-year horizon.
How I interpret this: You don’t have to believe we’ll hit that number exactly to see the signal: Petaluma has planned for a larger population than today, but the path to that growth depends heavily on what actually gets built, how quickly, and how policy constraints interact with market demand.
Population growth doesn’t mean people show up with completed houses waiting for them. It means:
If new construction lags household formation, prices and rents rise until demand is pushed out or satisfied.
Practical takeaway: In a market like Petaluma, “time in the market” often matters more than “timing the market,” because the city-level supply response is slow.
As communities grow without massive outward expansion, infill is where a lot of action happens:
Practical takeaway: Homes that fit the next generation’s lifestyle needs—walkability, low maintenance, energy efficiency—often see stronger demand.
When population and demand rise faster than supply, affordability issues intensify:
Practical takeaway: If you’re a buyer waiting for a “crash,” understand the difference between cyclical corrections and structural demand. Population growth contributes to the structural story.
If population and household demand grow steadily into the 2030s:
Strategy: keep your home’s “move-in ready” status high—kitchens, baths, roofs, systems, curb appeal. In an inventory-tight market, the nicest homes often sell fastest and at a premium.
Population growth supports buyer pools—but success still depends on pricing.
Strategy: don’t get greedy on list price; price slightly above comparable closed sales only if your property clearly beats them on upgrades, condition, or location. Otherwise, price at market to create urgency.
Buyers feel the most pressure when population growth collides with inventory constraints.
Strategy: focus on “value factors” instead of “bling factors”:
No forecast should be treated as guaranteed—especially through 2040. Major “risk factors” include:
That’s why I treat population projections as scenario planning, not destiny.
If you want my honest recommendation: treat the next few years as the time to position yourself, not procrastinate. Whether you’re buying, selling, or refinancing, the winning move is to align your strategy with the market that’s actually likely—not the one you wish existed.
If you tell me your neighborhood, price range, and timeframe, I can translate these population scenarios into a very practical plan (offer strategy, pricing expectations, and the trade-offs you should expect).
Discover what it is like to live in Rohnert Park’s M Section, including its homes, Magnolia Park, nearby schools, location, parking rules and current real estate consi… Read more
Mortgage rates may remain elevated after the Fed’s September 2026 rate increase, but correctly priced homes in Santa Rosa, Rohnert Park, Petaluma, Windsor, Cotati, and… Read more
Explore K Section’s location, Twin Creeks Park, nearby Sonoma State and the ownership costs to understand before buying.
A local look at M Section housing, Magnolia Park, nearby schools, current prices and what Rohnert Park buyers and sellers should know.

An updated look at today’s mortgage rates, the economic forces controlling them, what forecasters expect through 2027 and why timing the market may cost Sonoma County … Read more

A local comparison of 2026 home prices, housing choices, neighborhoods, commute options, schools and everyday lifestyle across three popular Sonoma County communities.
A City-by-City Guide to Houses, Condos and Townhomes Under $700K in Santa Rosa, Rohnert Park, Cloverdale, Cotati, Windsor and the Russian River
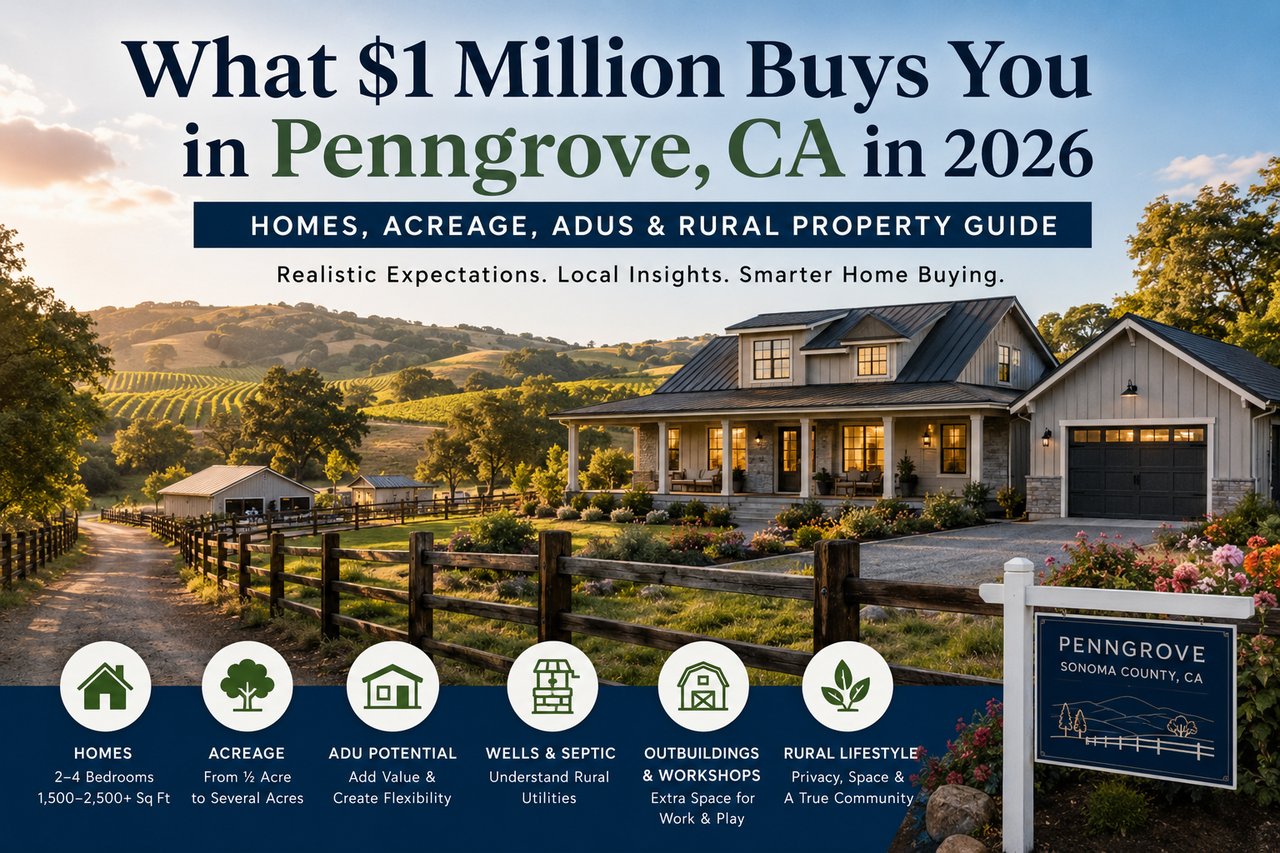
A Local Guide to Penngrove Real Estate Around $1 Million — Including Home Sizes, Acreage, ADU Potential, Wells, Septic Systems and What Buyers Should Expect Before Mak… Read more
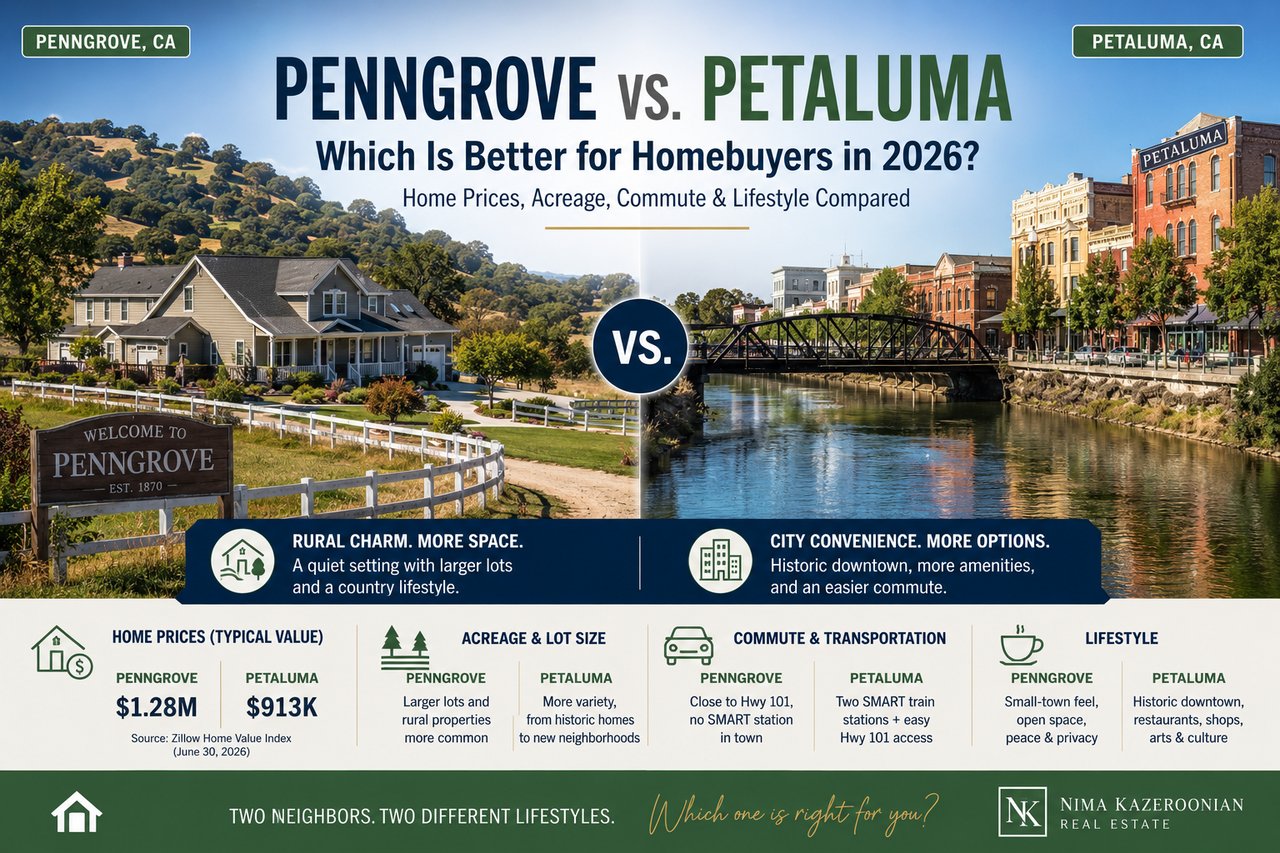
Penngrove offers more of the rural Sonoma County experience and larger-property opportunities, while Petaluma gives buyers a larger housing market, historic downtown, … Read more
Whether you're buying, selling, or exploring options, Nima is dedicated to making the process smooth, informed, and rewarding. Reach out today for a personalized consultation and let’s make your real estate goals a reality!