History of Mortgage Rates: 1950s‑Today and 2026 Outlook
Market Insights Nima Kazeroonian November 13, 2025
Market Insights Nima Kazeroonian November 13, 2025
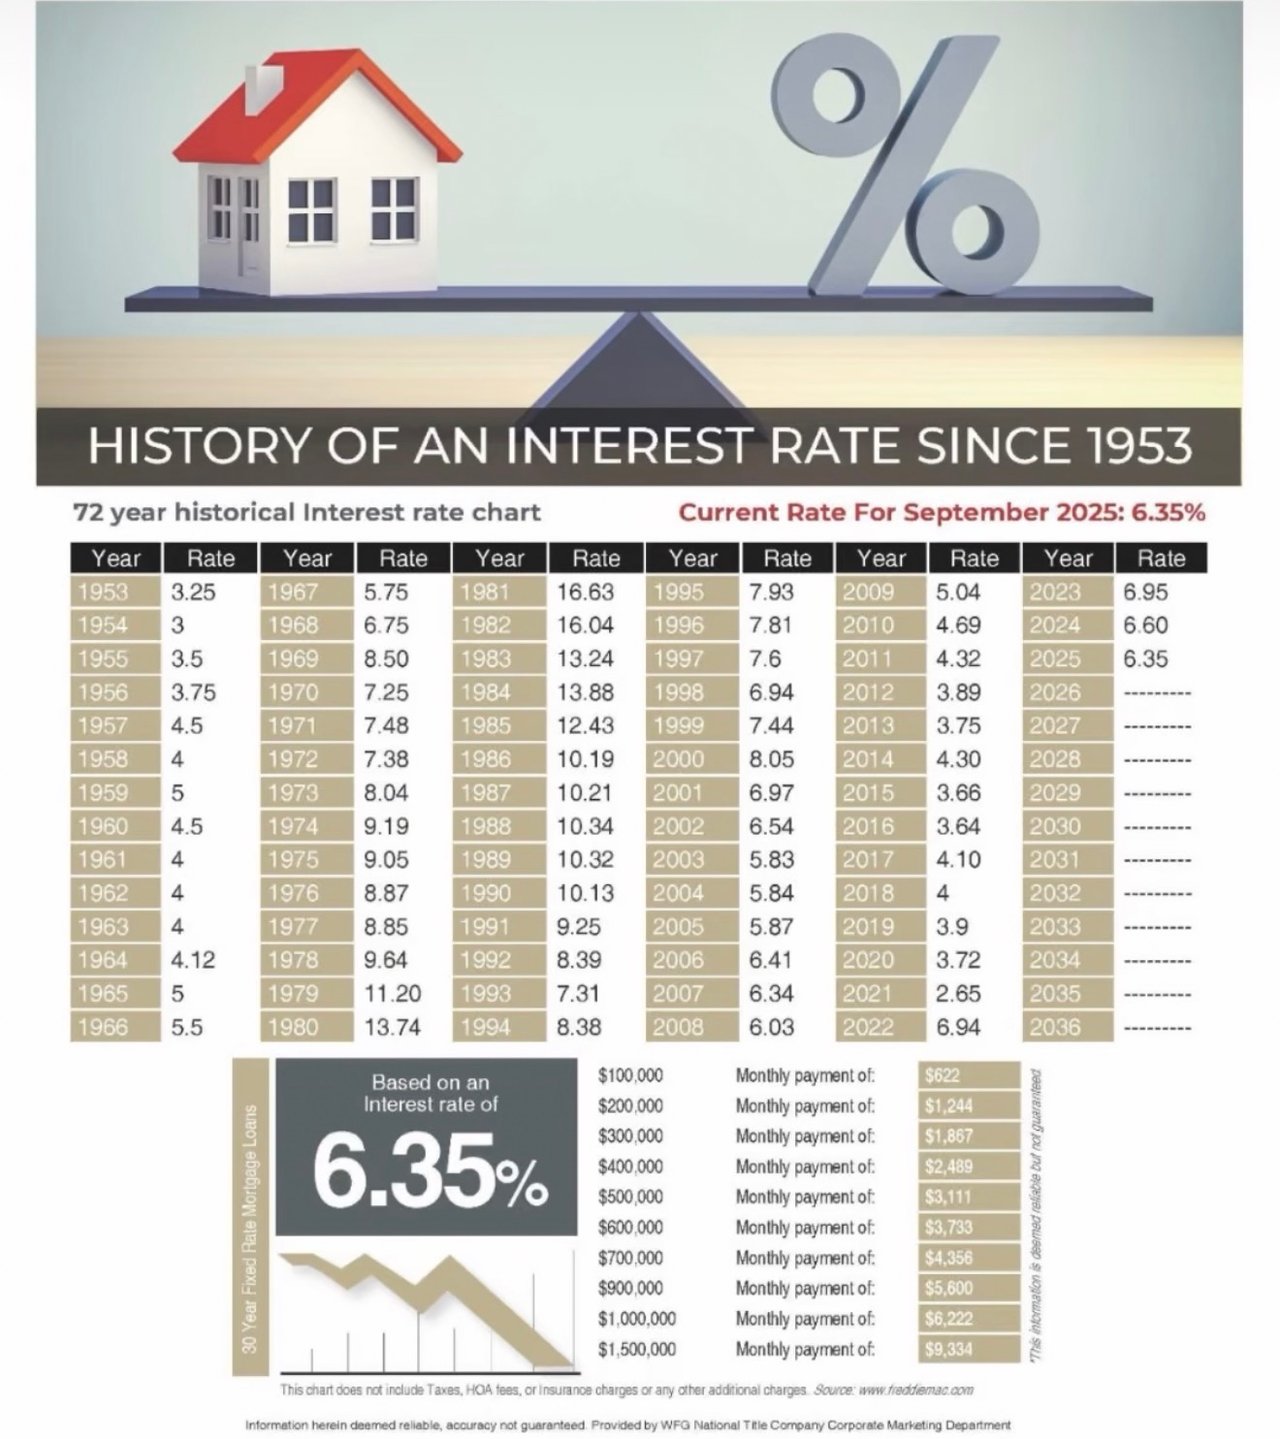
For over seven decades, mortgage rates have fluctuated dramatically in response to economic cycles, inflation, and Federal Reserve policy. According to a historical interest rate chart provided by WFG National Title Company, the current 30 year fixed mortgage rate for September 2025 is about 6.35%. This is not the highest on record—but it feels high compared to the pandemic lows.
Most economists think the days of sub‑3% mortgages are behind us. Forecasts from major housing institutions suggest modest relief but not a return to rock‑bottom rates:
In short, economists foresee mortgage rates staying in the 5.9%‑6.5% range through 2026. Small dips could occur if the economy weakens or if the spread between 10‑year Treasury yields and mortgage rates compresses—but don’t expect a return to pandemic‑era lows.
At the current ~6.35% rate, a 30‑year fixed mortgage costs roughly $622 per month for every $100,000 borrowed (excluding taxes and insurance). That means a $500,000 loan carries a principal‑and‑interest payment around $3,111, according to WFG National Title’s payment chart. While higher than recent years, these payments are still far lower than the double‑digit rates of the early 1980s.
Mortgage rates have been on a wild ride over the past 70+ years. From the heights of the early 1980s to the record lows of the pandemic, each era reflects broader economic forces—from inflation and monetary policy to global crises. Looking ahead to 2026, leading forecasts from Fannie Mae and the MBA suggest rates will likely hover near 6%, with only modest declines possible (www.fanniemae.com, www.resiclubanalytics.com). That may feel high compared to recent memory, but historically it’s a middle‑of‑the‑road level.
For prospective buyers and homeowners, the key is preparation. Rather than trying to time the perfect rate, focus on your budget, credit, and long‑term goals. Even with mortgage rates around 6%, there are opportunities to build equity and find a home that fits your needs. Always consult with a trusted mortgage professional to explore loan options and lock in a rate that works for you.

Along with this checklist, seeking guidance from a professional is always a good idea!


Gov't Shutdown


Less competition, motivated participants, and market insights for the season
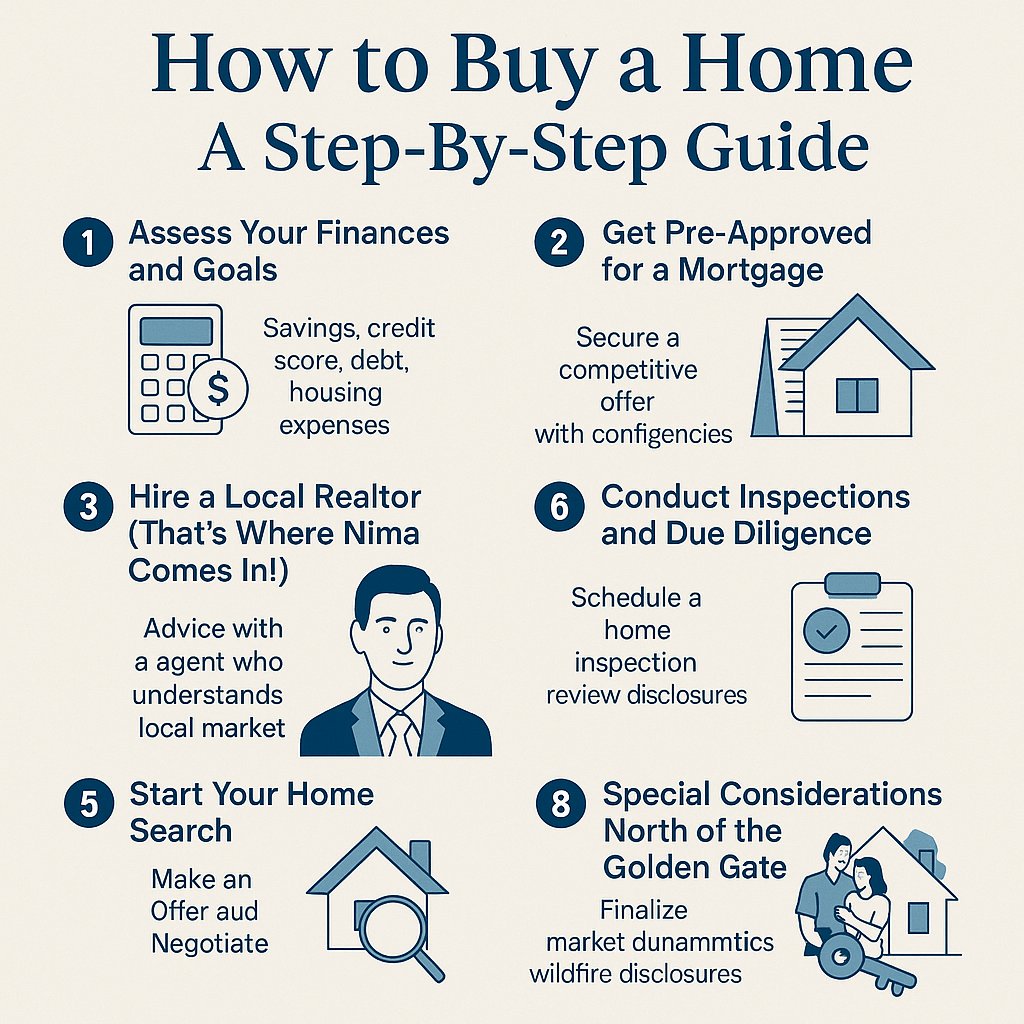
When to hire Nima, secure pre-approval, and navigate the North Bay market
Exploring the pros and cons of homeownership versus renting across different time horizons
Whether you're buying, selling, or exploring options, Nima is dedicated to making the process smooth, informed, and rewarding. Reach out today for a personalized consultation and let’s make your real estate goals a reality!