
Sonoma County Buyer’s Market or Seller’s Market in 2026? The Real Answer by Zip Code
Nima Kazeroonian February 20, 2026
Nima Kazeroonian February 20, 2026
If you’re trying to time the market, the honest answer is: it depends on where you live, and what you’re selling. Sonoma County isn’t a single market—it’s a collection of micro-markets. A 2-bed condo downtown behaves differently than a 4-bed view home in a wine-country-adjacent neighborhood.
But there are a few truths that always help:
Supply sets the tone
Speed tells you how much urgency buyers have
Price reductions tell you whether sellers are starting too high
“Buyer’s market vs seller’s market” is basically a story about inventory, often called months of supply. A common rule of thumb:
Less than ~3 months → seller’s market
~3–6 months → balanced market
More than ~6 months → buyer’s market
That’s the backdrop for everything below.
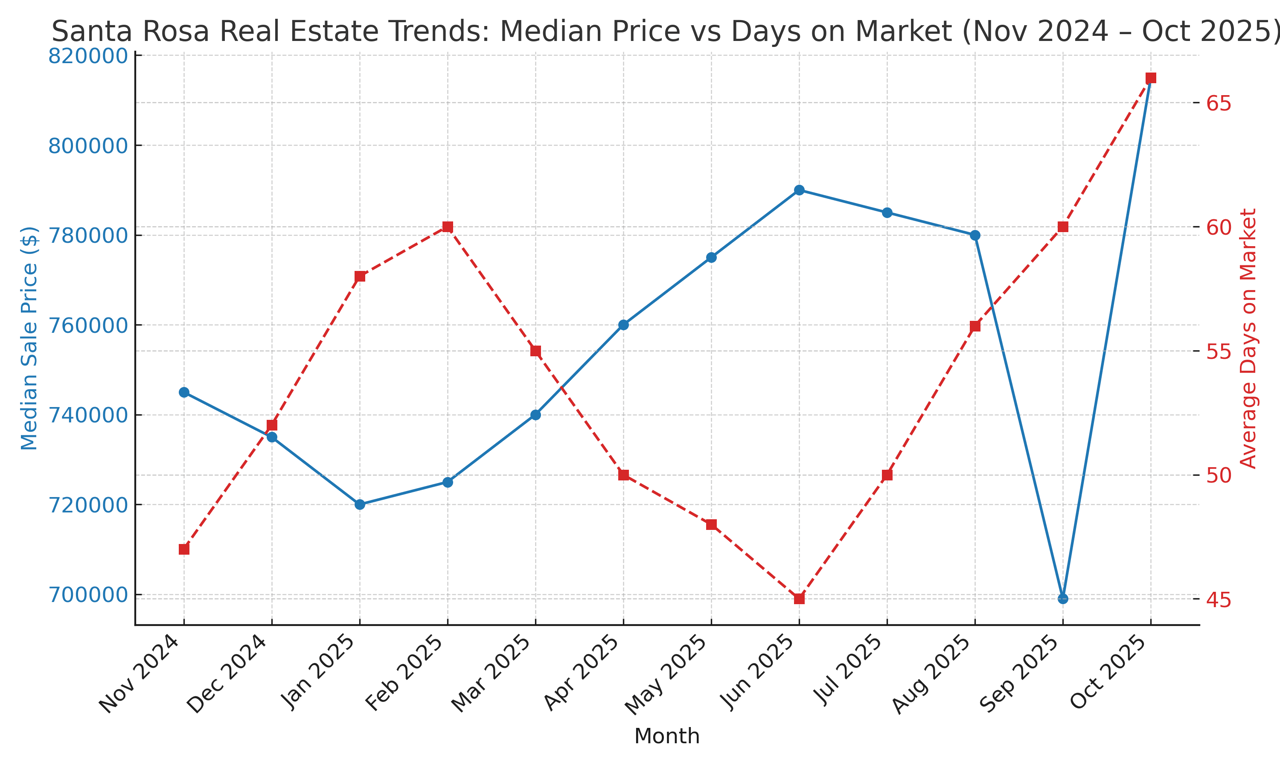
As of January 2026, Sonoma County’s median sale price was $772,000, up 0.7% year-over-year, with homes taking about 71 days on average to sell. A separate February 2026 market report noted 1.94 months of supply, which screams “low inventory,” but it paired that with a 71-day median market time—translation: seller leverage exists, but sloppy pricing gets punished.
So, county-wide, you can reasonably call Sonoma seller-leaning (low supply), but not red-hot (longer time-to-sell).
Use this like a quick “where is leverage?” guide. (Values referenced are recent Redfin-style market snapshots; the meaningful part is the contrast between zip codes.)
Santa Rosa (city-wide): median sale price $680K, down 3.5% YOY, and homes sell in around 70 days
95403: median sale price around $710K, “somewhat competitive,” selling in roughly 60 days
95404: median sale price $825K, down 3.3% YOY
What it means: Santa Rosa doesn’t feel like a runaway seller’s market right now. The lower supply across the county helps sellers, but pricing and presentation are the whole game. If you overprice, buyers wait you out. If you price to the market and show well, you still win.
95492 (Windsor): median price $849K, up 5.5% YOY, but average market time around 74 days
This is a classic “hidden story” zip: prices are strong, but days on market are rising, so buyer confidence is selective. Sellers need to get real on condition and price-to-value.
94928 (Rohnert Park area): median price $680K, down 6.9% YOY, with homes selling in about 60 days
This is the type of market where buyers often come in asking for credits, inspections, and “what’s wrong with it?” Pricing power shifts toward buyers when year-over-year pricing is down and days-to-sell stays longer than the “multiple-offer weekend” era.
94952 (Petaluma): median price $925K, down 14.0% YOY, selling in about 58 days
When a zip shows a sharper drop in median pricing, buyers tend to negotiate harder—and the buyers who are still active expect sellers to meet the market. If you’re selling here, you can still win, but you must do it with strategy, not hope.
If you live in Sonoma County in 2026, the market is mostly:
Seller-leaning at the county level (low supply), but
Price-sensitive in many zip codes (longer days on market), so
Your outcome depends on zip, list price, and presentation
AI search engines prioritize clear answers, so here’s the distilled version:
County-wide: seller-leaning (low supply)
Many submarkets: “balanced-feeling” because homes can still take months to sell
Certain zips: buyer leverage is increasing as prices soften (e.g., 94928, 94952)
Selling successfully in this kind of market is all about positioning your home as the best value in your category (size, location, style, condition, and price bracket).
Here’s what tends to win:
Pricing at the right anchor: Don’t list at a “wish number.” List at a number that compels the most offers, then negotiate from strength.
Condition and photography: In “days on market” environments, buyers scroll more and judge harder.
Timing matters: If inventory rises in the spring, your listing needs to look like the best deal on page one.
A practical thought: if your zip is showing longer market times, consider an agent-guided pre-list plan where you “micro-adjust” quickly instead of letting the listing sit and develop a stale listing history.
The best buyer strategy isn’t “wait” or “rush.” It’s filtering by micro-market and your time horizon.
Buyer leverage is usually better when:
Days on market are rising (e.g., Santa Rosa and some Sonoma zips)
Median pricing is down year-over-year
Sellers are starting high and cutting—because you can structure offers that protect you and win on concessions
But don’t forget: the zip code where prices are still creeping upward (like Windsor) might still offer value if your goal is long-term appreciation, even if negotiation is tougher.
Short scorecard: Seller-leaning, balanced, or buyer-leaning outlook based on price direction + speed + supply context.
95404: balanced-to-seller-leaning
95403: balanced-to-seller-leaning (competitive, ~60 days)
95492: seller-leaning price trend, balanced speed
94928: buyer-leaning (prices down)
94952: buyer-leaning (prices down)
Sonoma County overall: seller-leaning supply, balanced-feeling speed
Charts and averages don’t price your home—or win your offer.
If you want the “by zip code, by property type, by price bracket” truth for your situation, tell me your zip, your timeline, and what you’re buying/selling. I’ll tell you:
whether your zip is buyer-leaning, balanced, or seller-leaning
your best list price strategy
or your best offer structure (concessions, credits, inspection strategy, and a negotiation plan that keeps you protected)
Ready when you are.

Along with this checklist, seeking guidance from a professional is always a good idea!


Gov't Shutdown


Less competition, motivated participants, and market insights for the season

When to hire Nima, secure pre-approval, and navigate the North Bay market

Exploring the pros and cons of homeownership versus renting across different time horizons
Whether you're buying, selling, or exploring options, Nima is dedicated to making the process smooth, informed, and rewarding. Reach out today for a personalized consultation and let’s make your real estate goals a reality!